Data review: J.P. King Jr. Middle School shows resilience
Published 7:00 am Monday, March 18, 2024

- (Courtesy of Franklin City Public Schools)
|
Getting your Trinity Audio player ready...
|
Editor’s note: Franklin City Public Schools administrators presented a Quarter 2/Semester 1 student performance data review for the 2023-24 school year to the Franklin City School Board on Thursday, Feb. 29. This is the second in a three-part series covering the review, school-by-school.
A Feb. 29 data review of J.P. King Jr. Middle School student performance revealed some incremental gains in many areas amid difficult circumstances.
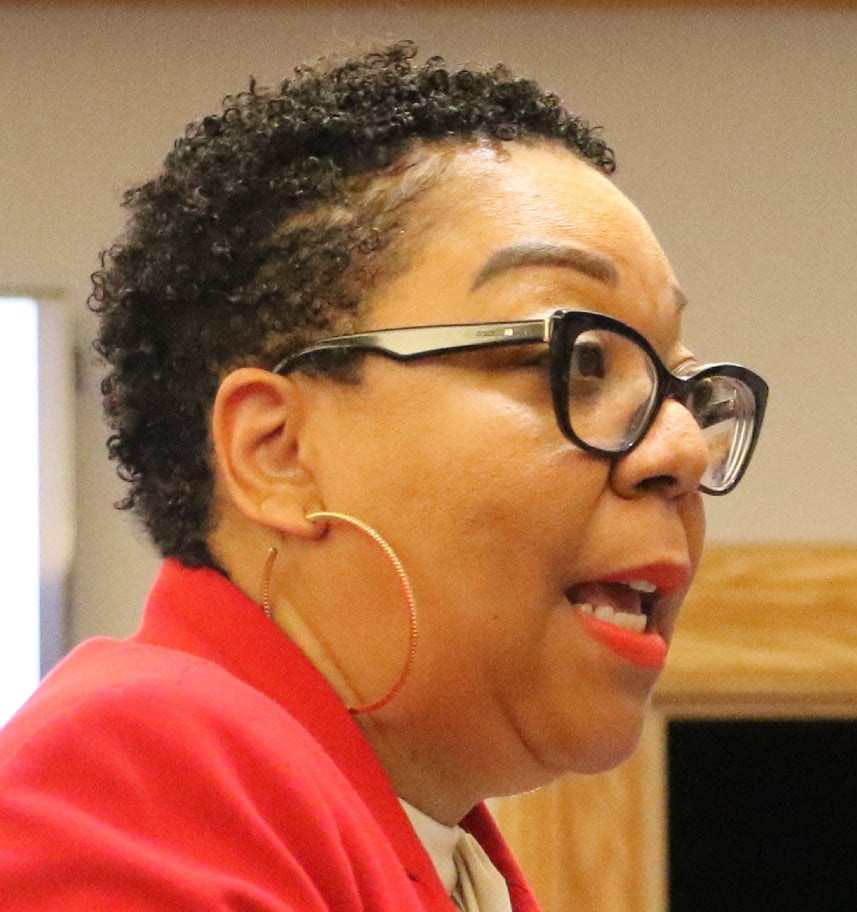
Krystal Thompkins
Franklin City Public Schools Director of Curriculum and Instruction Krystal Thompkins presented the data, and she set the tone for the review with her comments on the first slide in her presentation, which was as follows:
JPK Reading BMK Comparison
Grade 6 Reading
Red: Quarter 1 – 74.63%; Quarter 2 – 72.06%
Yellow: Q1 – 10.45%; Q2 – 11.76%
Green: Q1 – 14.93%; Q2 – 16.18%
Average Score: Q1 – 42%; Q2 – 47%
The percentages listed for “Average Score” represent how all students at the relevant grade level and in the relevant school subject scored on the SOL, assuming a 0% to 59% would be red and failing, 60% to 70% would be yellow and passing, and 71% to 100% would be green and passing comfortably.
Thompkins made note of the evident improvement in Grade 6 Reading, slight though it was.
“I’ll take it at JPK,” she said. “I’ll take the progress, no matter how small it might appear. The fact that we’ve had some changes, I think the resilience you’re going to see as we move forward.”
FCPS Superintendent Dr. Carlton Carter announced Tuesday, March 12, that Dr. Wayne Manley and William Hicks, both curriculum specialists, had been named co-administrators at J.P. King Jr. Middle School, bringing some needed leadership to the school.
Grade 6 Reading Student Growth Assessment Data
Red — Needs Support: 35; Decreased: 20
Yellow — At Risk: 13; Stayed the Same: 14
Green — Prepared: 6; Grew 1 Band+: 16
Thompkins helped explain what the above numbers mean.
“So when you take a look at their reading growth score, there were 35 who failed in the fall but only 20 failed in the winter,” she said. “We had 13 that passed (in the fall), and 14 that passed (in) the winter. When you say, ‘prepared,’ that means those kids are on track to also pass the SOL. There were six of those students who passed, but 16 of them grew one band or more — that’s significant, and I’m really proud of that.”
“Band” refers to the color bands identified, namely red, which includes students who are failing the SOL and need additional support; yellow, which includes students who are passing the SOL but at risk of failing; and green, which includes students who are passing the SOL comfortably and are prepared.
JPK Grade 7 Reading Benchmark Comparison
Red: Quarter 1 – 70.59%; Quarter 2 – 75.86%
Yellow: Q1 – 8.24%; Q2 – 11.49%
Green: Q1 – 21.18%; Q2 – 12.64%
Average Score: Q1 – 48%; Q2 – 45%
“You can also see in reading seventh grade, slightly different story, but at least we had a higher number of kids in the yellow who are showing some progress,” Thompkins said. “We know that we need a little more help in reading and seventh grade, but we are continuing to make progress.
“And they also have tutoring on Mondays and Wednesdays, but we also have some staff who push in to those English classes to support through our ALL In grant. There’s after school, and then they’re folks that come to us every day.”
Grade 7 Reading Student Growth Assessment Data
Red — Needs Support: 46; Decreased: 25
Yellow — At Risk: 23; Stayed the Same: 11
Green — Prepared: 7; Grew 1 Band+: 36
“If you take a look at those who grew, we went from seven students who showed growth (in the green) to 36 who showed growth,” Thompkins said. “So even though the yellow went down, it’s OK if that goes down, as long as the green goes up.”
JPK Grade 6 Math Benchmark Comparison
Red: Quarter 1 – 96.92%; Quarter 2 – 73.53%
Yellow: Q1 – 3.08%; Q2 – 7.35%
Green: Q1 – 0%; Q2 – 19.12%
Average Score: Q1 – 36%; Q2 – 48%
“If you take a look, we had 96% of students Quarter 1 benchmark who did not pass,” Thompkins said. “Now we move to (73%). We went from 3% in yellow to 7%. We didn’t have any students who passed in green for this benchmark (in the fall), but we had 19.12% of those kids who passed (in the winter).”
Grade 6 Math Student Growth Assessment Data
Red — Needs Support: 51; Decreased: 12
Yellow — At Risk: 7; Stayed the Same: 20
Green — Prepared: 0; Grew 1 Band+: 22
“So when we take a look at the SGA for math for sixth grade, we have 51 of those students who did not pass in the fall compared to 12 who did not pass in the winter,” Thompkins said. “Seven of those students who passed fall, 20 in the winter. And then of course, we had 22 students who actually exceeded and they grew by one band or more.
“We give credit for students who pass and also credit for one student who went one band so that in your calculations increases your overall SOL composite score,” she added.
JPK Grade 7 Math Benchmark Comparison
Red: Quarter 1 – 87.95%; Quarter 2 – 81.61%
Yellow: Q1 – 4.82%; Q2 – 12.64%
Green: Q1 – 7.23%; Q2 – 5.75%
Average Score: Q1 – 43%; Q2 – 39%
“So when you see the comparison, we’re slightly coming down off of the red, we’re going up in yellow, we didn’t meet all of our expectations for green, but as long as that red is growing down, the yellow is going up, those are incremental growth points that we can really be proud of,” Thompkins said.
Grade 7 Math Student Growth Assessment Data
Red — Needs Support: 57; Decreased 21
Yellow — At Risk: 4; Stayed the Same: 29
Green — Prepared: 2; Grew 1 Band+: 10
“As you can see when they took the Student Growth Assessment given by the state, 57 of those math students did not pass, compared to the winter where there were 21,” Thompkins said. “You look at those who passed — there were four in the fall. Now we’ve got 29 in the winter, and two grew in the fall. Ten grew at least one band in the winter — that’s significant growth.”
In a March 5 interview, Ward 1 Board Member and Board Chair Robert Holt shared some of his thoughts on the middle school data presented.
“Right now, the middle school is making more growth progress than the other two schools, so we’re very pleased with that,” he said. “Of course, there are only two grades over there now — sixth and seventh, and next year, sixth will move to S.P. Morton and seventh will move to the high school to make room for the career tech school.”


