FCPS to use benchmark data to grow
Published 9:46 am Wednesday, December 31, 2014
FRANKLIN
With the first quarter of benchmark data back, Franklin City Public School Division Superintendent Willie J. Bell said the system has some work to do.
Bell and Director of Instruction Shannon Smith chose to present the data differently than they have in the past. The benchmark test, which is of a higher rigor than what a student might expect, focuses on a student scoring at least 70 percent on each test.
To have a passing Standard of Learning test, Bell said a student does not need to score a 70 percent. However, the superintendent said that if a system can get 60 percent of students scoring a 70 percent, then the SOL results at the end of the year will be 15 to 20 percent higher than that.
“This is looking deeper than just the surface,” Bell said. “So I don’t want you to be alarmed. Understand, that we are looking to grow by using this data.”
All figures are as of Dec. 15.
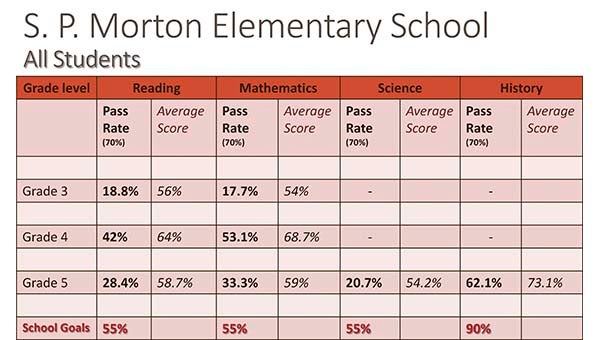
At S.P. Morton Elementary School, the goals are to have a standard of learning pass rate of 55 percent in reading, mathematics and science; and a 90 percent pass rate in history. To be fully accredited, the state accountability requires a 70 percent pass rate for math, science and history, and a 75 percent pass rate for reading.
Last year, the results at SPM were 39 in reading, 41 in math, 85 in history and 30 in science.
After quarter one, the benchmarks are 18.8 percent of all third graders scoring a 70 or above in reading; 17.7 percent of third graders scoring a 70 or above in math; 42 percent of fourth graders scoring a 70 percent or above in reading and 53.1 percent in math. For fifth-graders, who are tested on all four SOLs, the benchmarks are 28.4 percent scoring a 70 or above in reading; 33.3 percent in math; 20.7 percent in science; and 62.1 percent in history.
In third grade, the average scores are 56 percent for reading and 54 percent for math. In fourth grade, the average scores are 64 percent in reading and 68.7 percent for math. The fifth grade average scores are 58.7 percent in reading; 59 percent in math; 54.2 in science and 73.1 in history.
“What does this tell Mr. [SPM Principal Jason] Chandler?” Bell asked. “This tells him that he needs to get his history teacher to work with his reading teacher. It’s the same group of kids. Virginia History students are still required to read and comprehend. What strategies are happening in history that are not happening with the other reading teachers?”
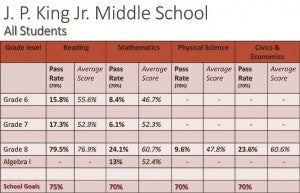
At J.P. King Jr. Middle School, the goals for the end of the year are to achieve the state accreditation scores of 75 percent in reading, and 70 percent in math, science and social science. Last year, JPK had a reading pass rate of 69 percent, a math rate of 64 percent, a social science rate of 68 percent and a science rate of 57 percent.
The number of students to achieve a 70 or higher in grade six reading is 15.8 percent; sixth-grade math 8.4 percent; seventh-grade reading 17.3 percent; and seventh-grade math 6.1 percent. Average scores are 55.6 percent for grade six reading; 46.7 percent in grade six math; 52.9 in grade seven reading; and 52.3 in grade seven math.
Eighth-graders are tested in reading, math, physical science, civics and economics and algebra I. 79.5 percent of all eighth-graders received a 70 percent or higher in reading; 24.1 percent in math; 9.6 percent in physical science; 23.6 percent in civics; and 13 percent in algebra I. The average scores are 76.9 percent in reading; 60.7 percent in math; 47.8 percent in physical science; 60.6 percent in civics; and 52.4 percent in algebra I.
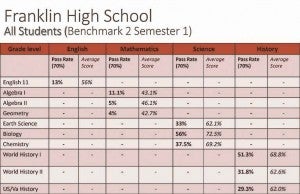
At Franklin High School, the SOL goals are to achieve an 80 percent pass rate in reading and math, and a 90 percent pass rate in history/social science and science. Last year, those rates were 73 in reading, 73 in math, 85 in history and 81 in math.
English 11 students had an average score of 56 percent, and 13 percent of the students passed at a rate of 70 percent or above.
In math, algebra I students had an average score of 43.1 percent, and 11.1 percent passed at a rate of 70 or higher. Algebra II students had an average score of 46.1 percent — 5 percent received a 70 percent or above. In geometry, the average score was 42.7 percent and 4 percent of students scored a 70 or higher.
In science, high school students had an average score of 62.1 percent in earth science, and 33 percent achieved a 70 percent or above. For biology, the average score was 72.5 percent and 56 percent of students achieved a 70 or above. Chemistry students had an average score of 69.2 percent, and 387.5 percent of students had a score of 70 percent or above.
Finally, in history, FHS students achieved an average score of 68.8 in world history I, and 51.3 percent of them passed at a rate of 70 or above. In world history II, the average score was 62.6 and the percent to hit 70 or above was 31.8. U.S./Va. history students scored 62 percent on average and 29.3 percent of FHS students achieved a 70 or above.
Smith said the average scores are not an SOL predictor, as the SOL test is cumulative, while the benchmarks only cover data from the specific quarter.
“We own the numbers,” Smith said. “And we know the faces that go with those numbers. The principals can speak it, and they have the plans to address them.”
Smith said they will go back and cover the strands from quarter one and make sure students are better picking up the content on a cognitive level, while also working in quarter two content.
“We have a lot of work to do, looking at the numbers,” Smith said, adding that, “We would just like to say that faculty, staff, parents and the many volunteers we have are working together to try to move our kids forward to achieve success.”


